MICE Industry Operators Energy Saving and Carbon Reduction Zone

Carbon Footprint Calculator | User Guide
Welcome to the MICE Events Carbon Footprint Calculator!
This tool is designed to assist MICE organizers and participants in estimating CO2e emissions through a simple and intuitive process. By inputting data regarding travel, energy usage, accommodation, production and waste, the system automatically performs the conversion and generates a downloadable carbon report. This user guide will lead you through the end-to-end process—from login and data entry to result analysis and report export. It is designed to help you effectively monitor event emissions, providing a solid foundation for sustainable planning and continuous improvement.

Calculation Basis & Methodology

The calculator is built upon the Ministry of Environment’s Carbon Footprint Information Platform and the SimaPro international database, incorporating MICE event carbon emission data collected and updated by the expert team through numerous on-site inventories. The calculation scope covers travel, accommodation, catering, electricity, natural gas, and more. To enhance the alignment between estimations and real-world scenarios, the tool also references public statistics from the Energy Administration, CPC Corporation, and Taiwan High Speed Rail.

Five Key Emission Categories

The carbon footprint calculator estimations are based on the following five key emission categories:

I. Travel

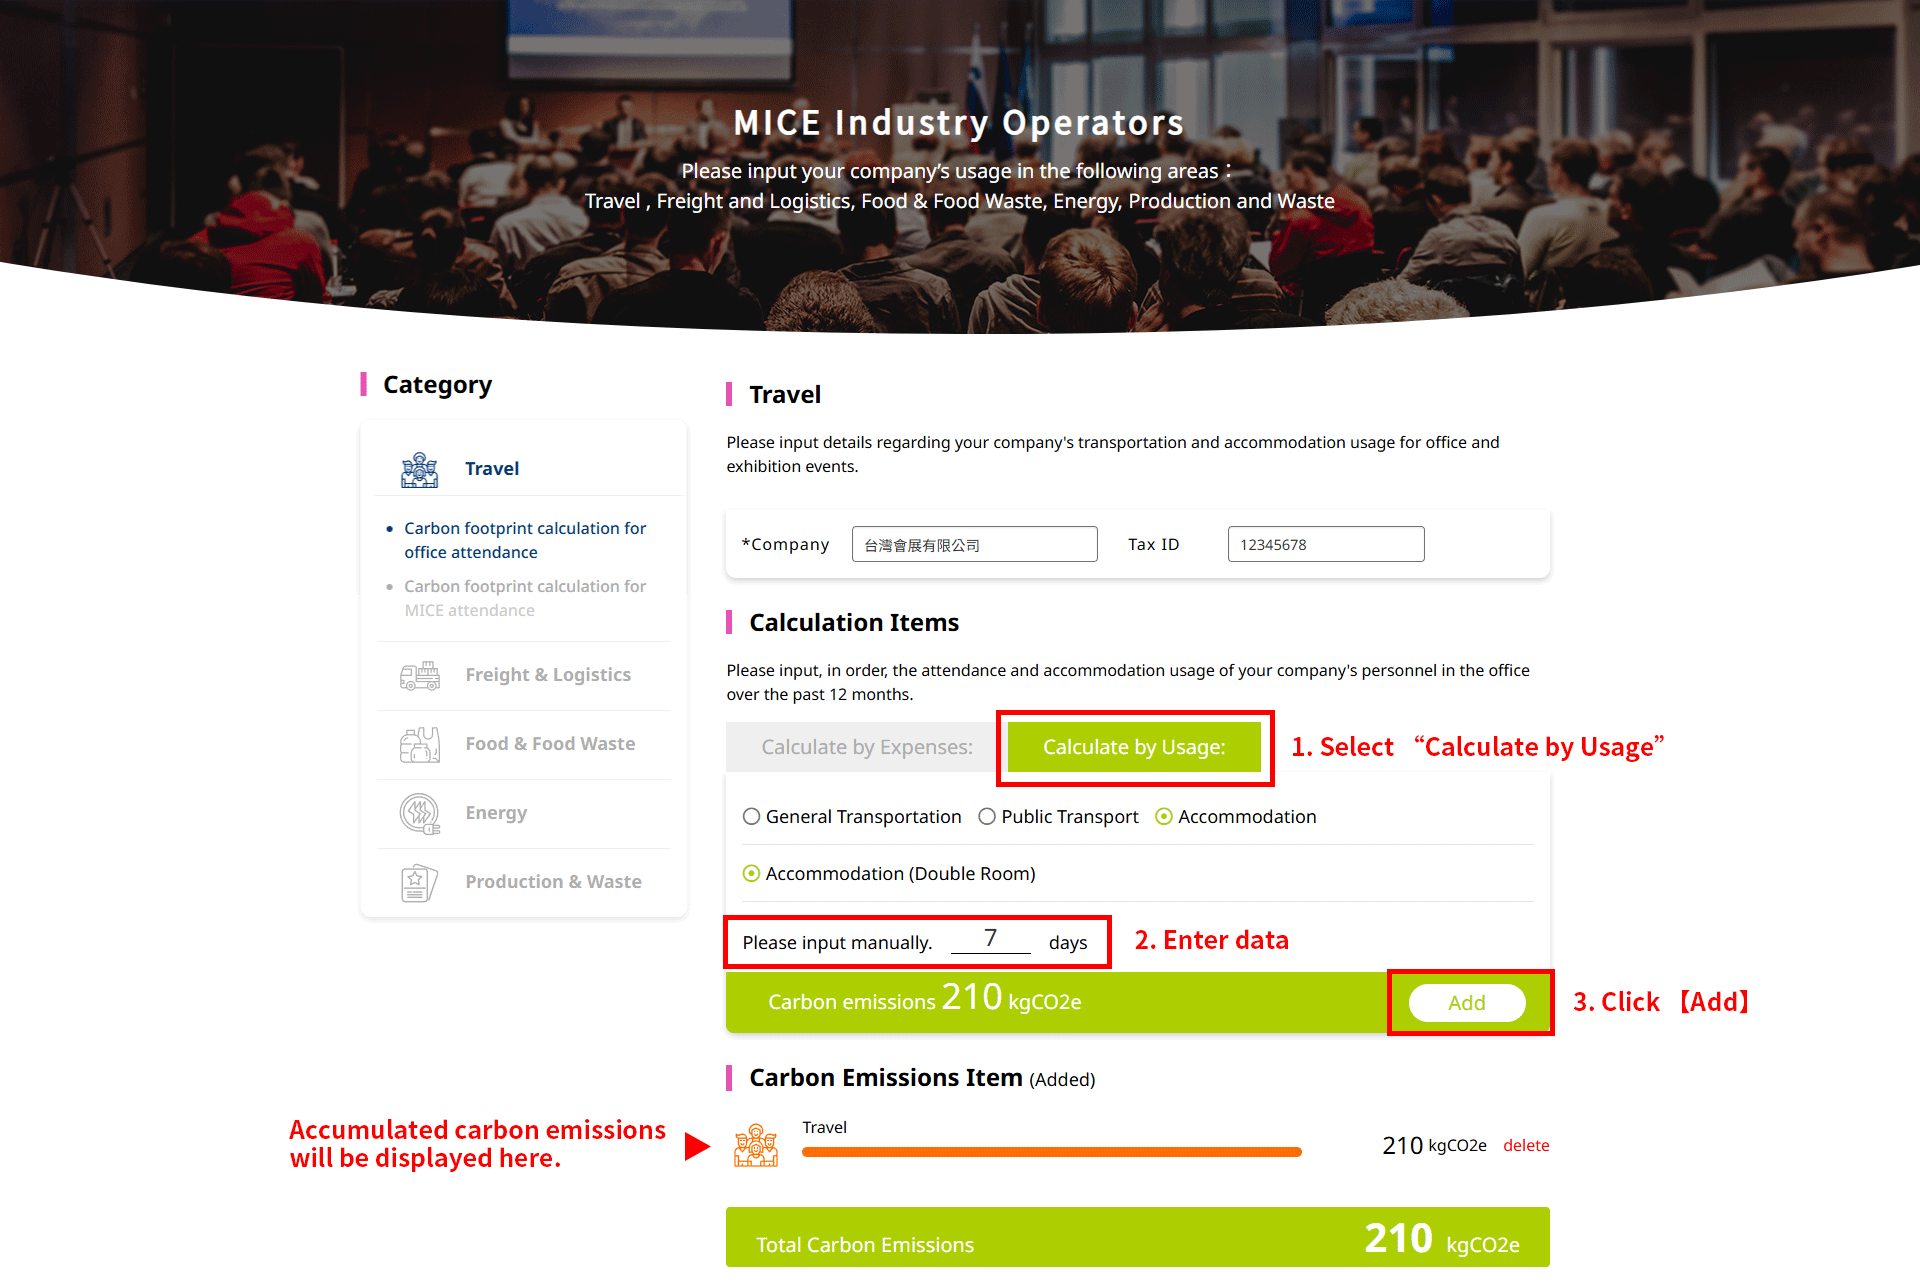
Travel and accommodation for personnel during office and exhibition events.

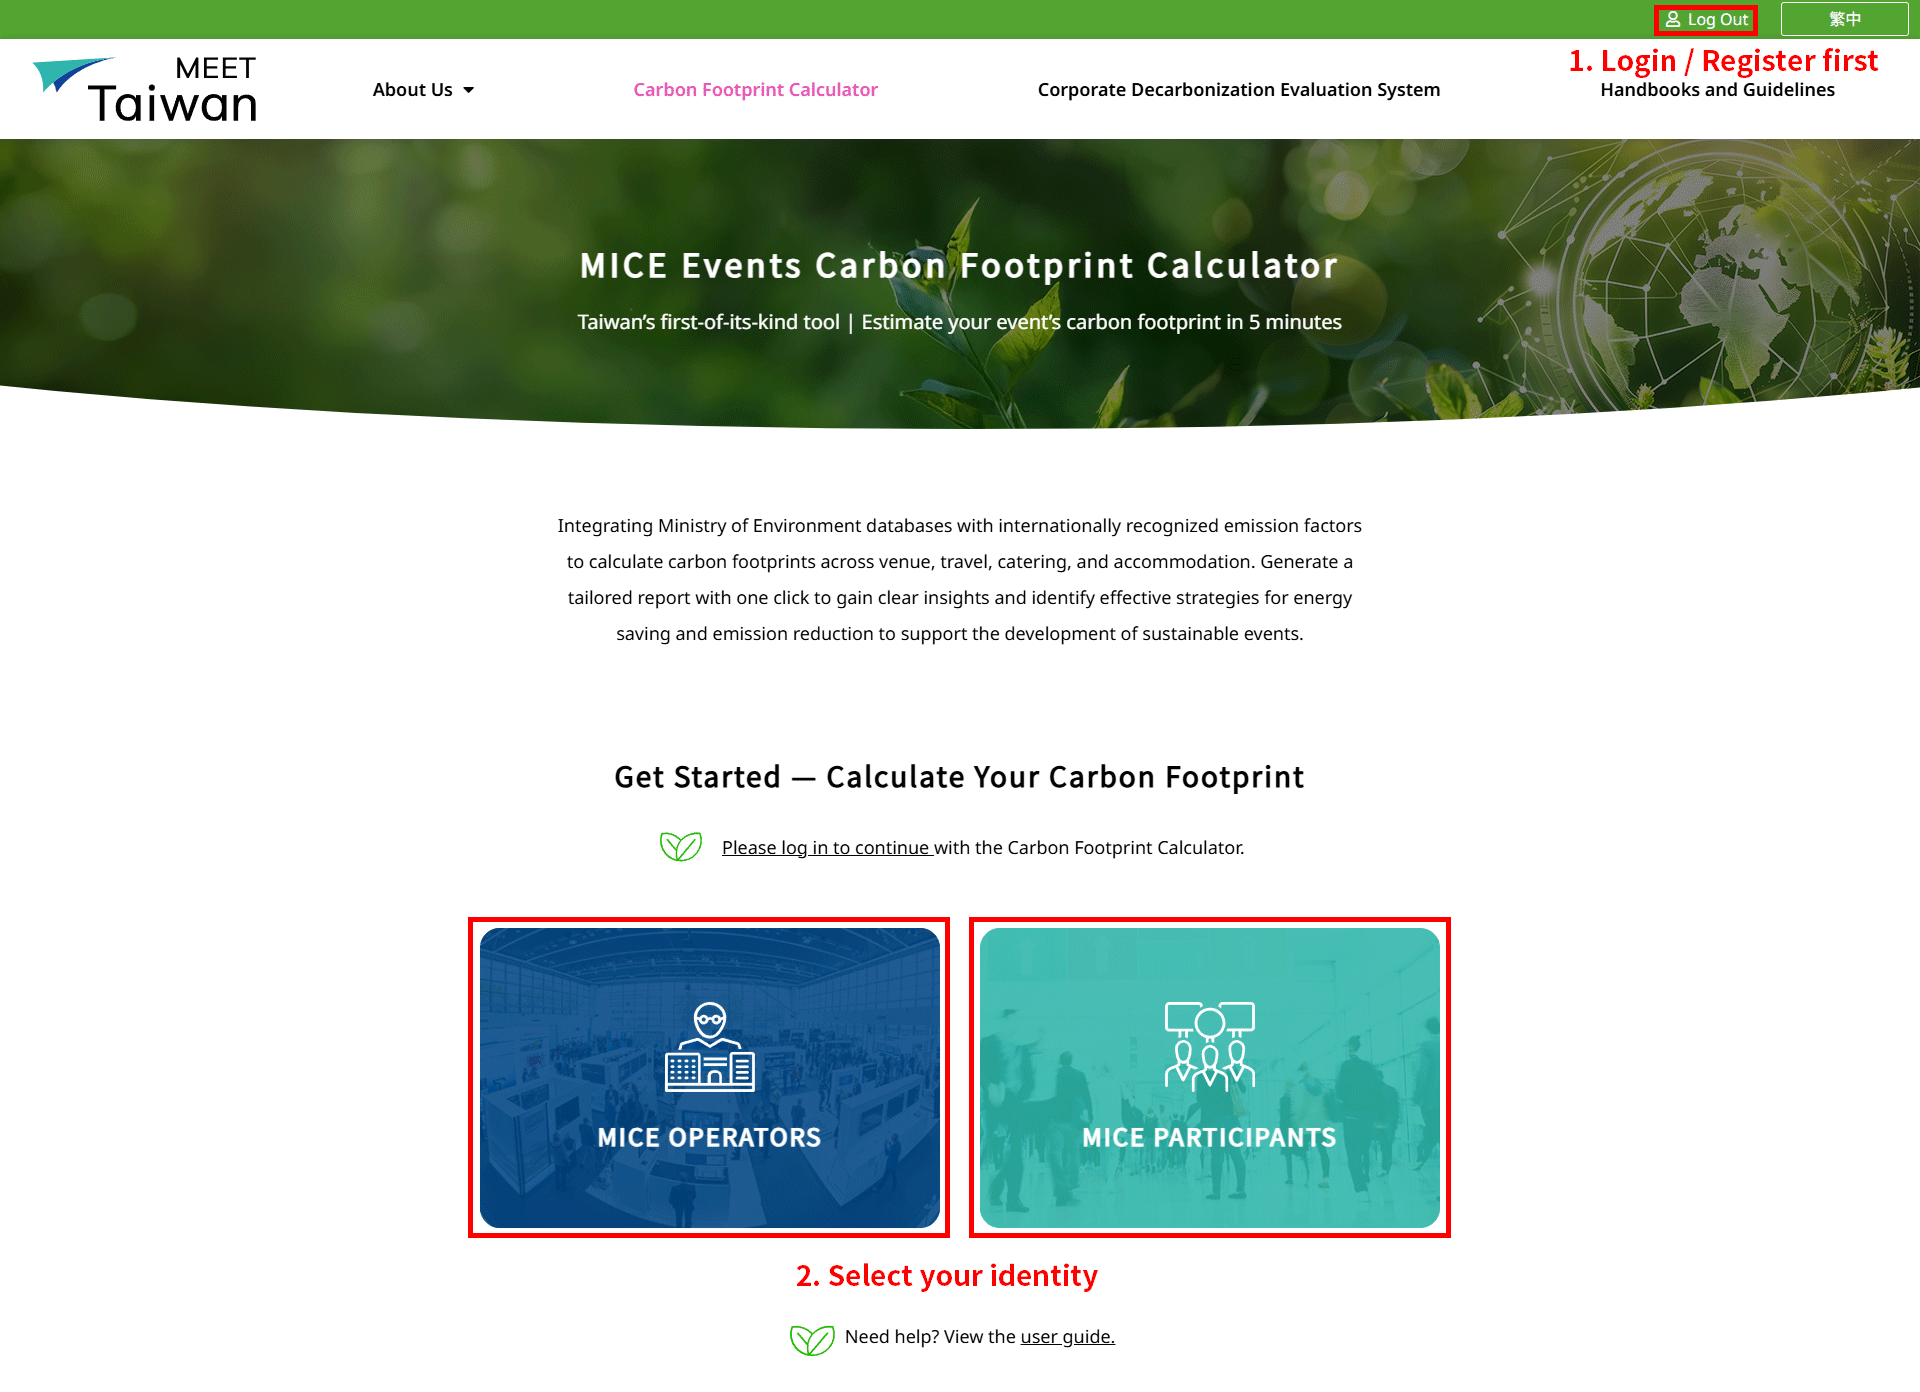
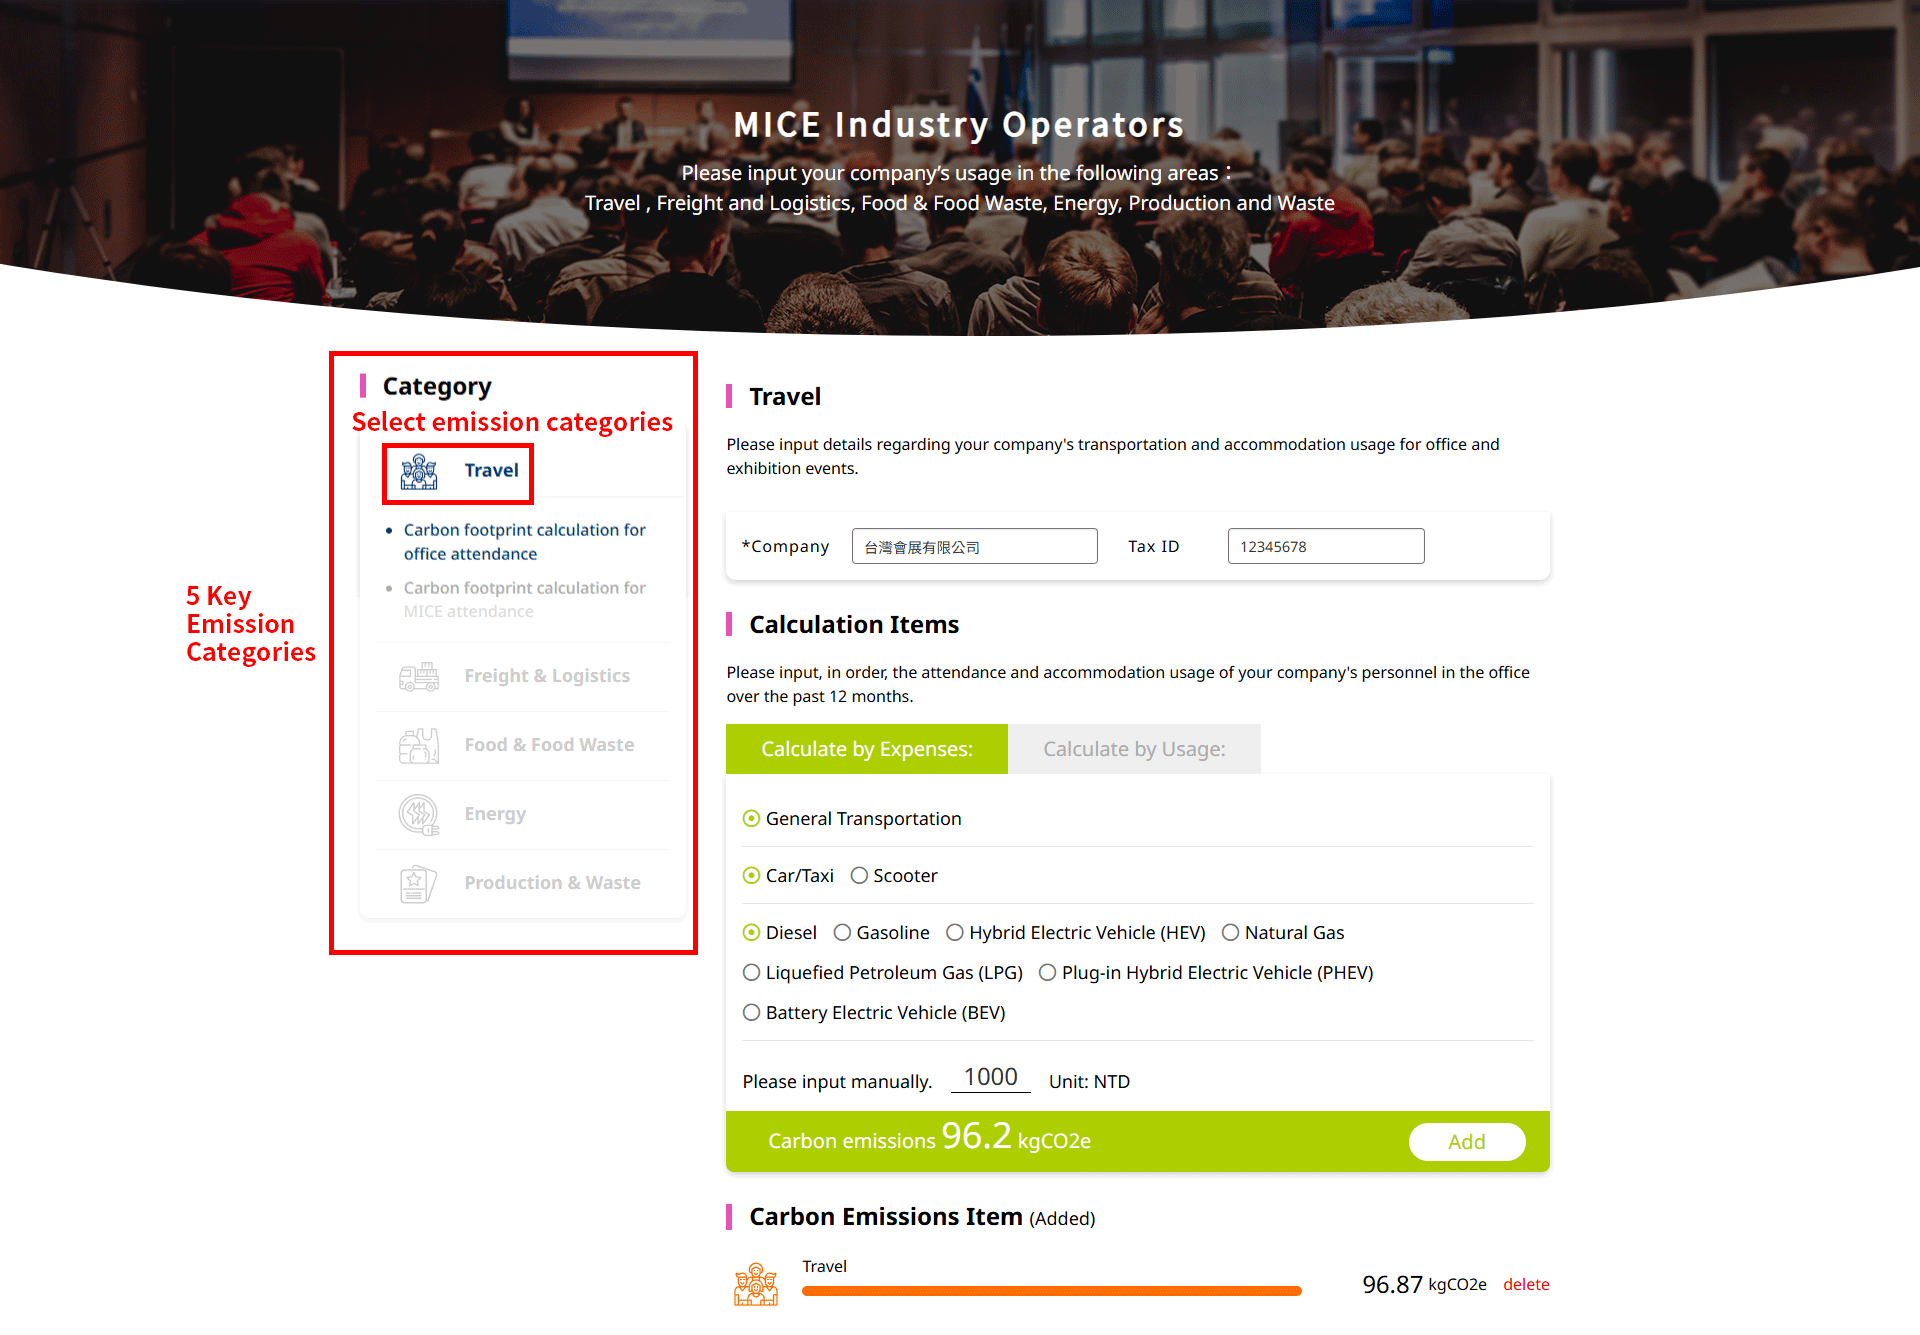
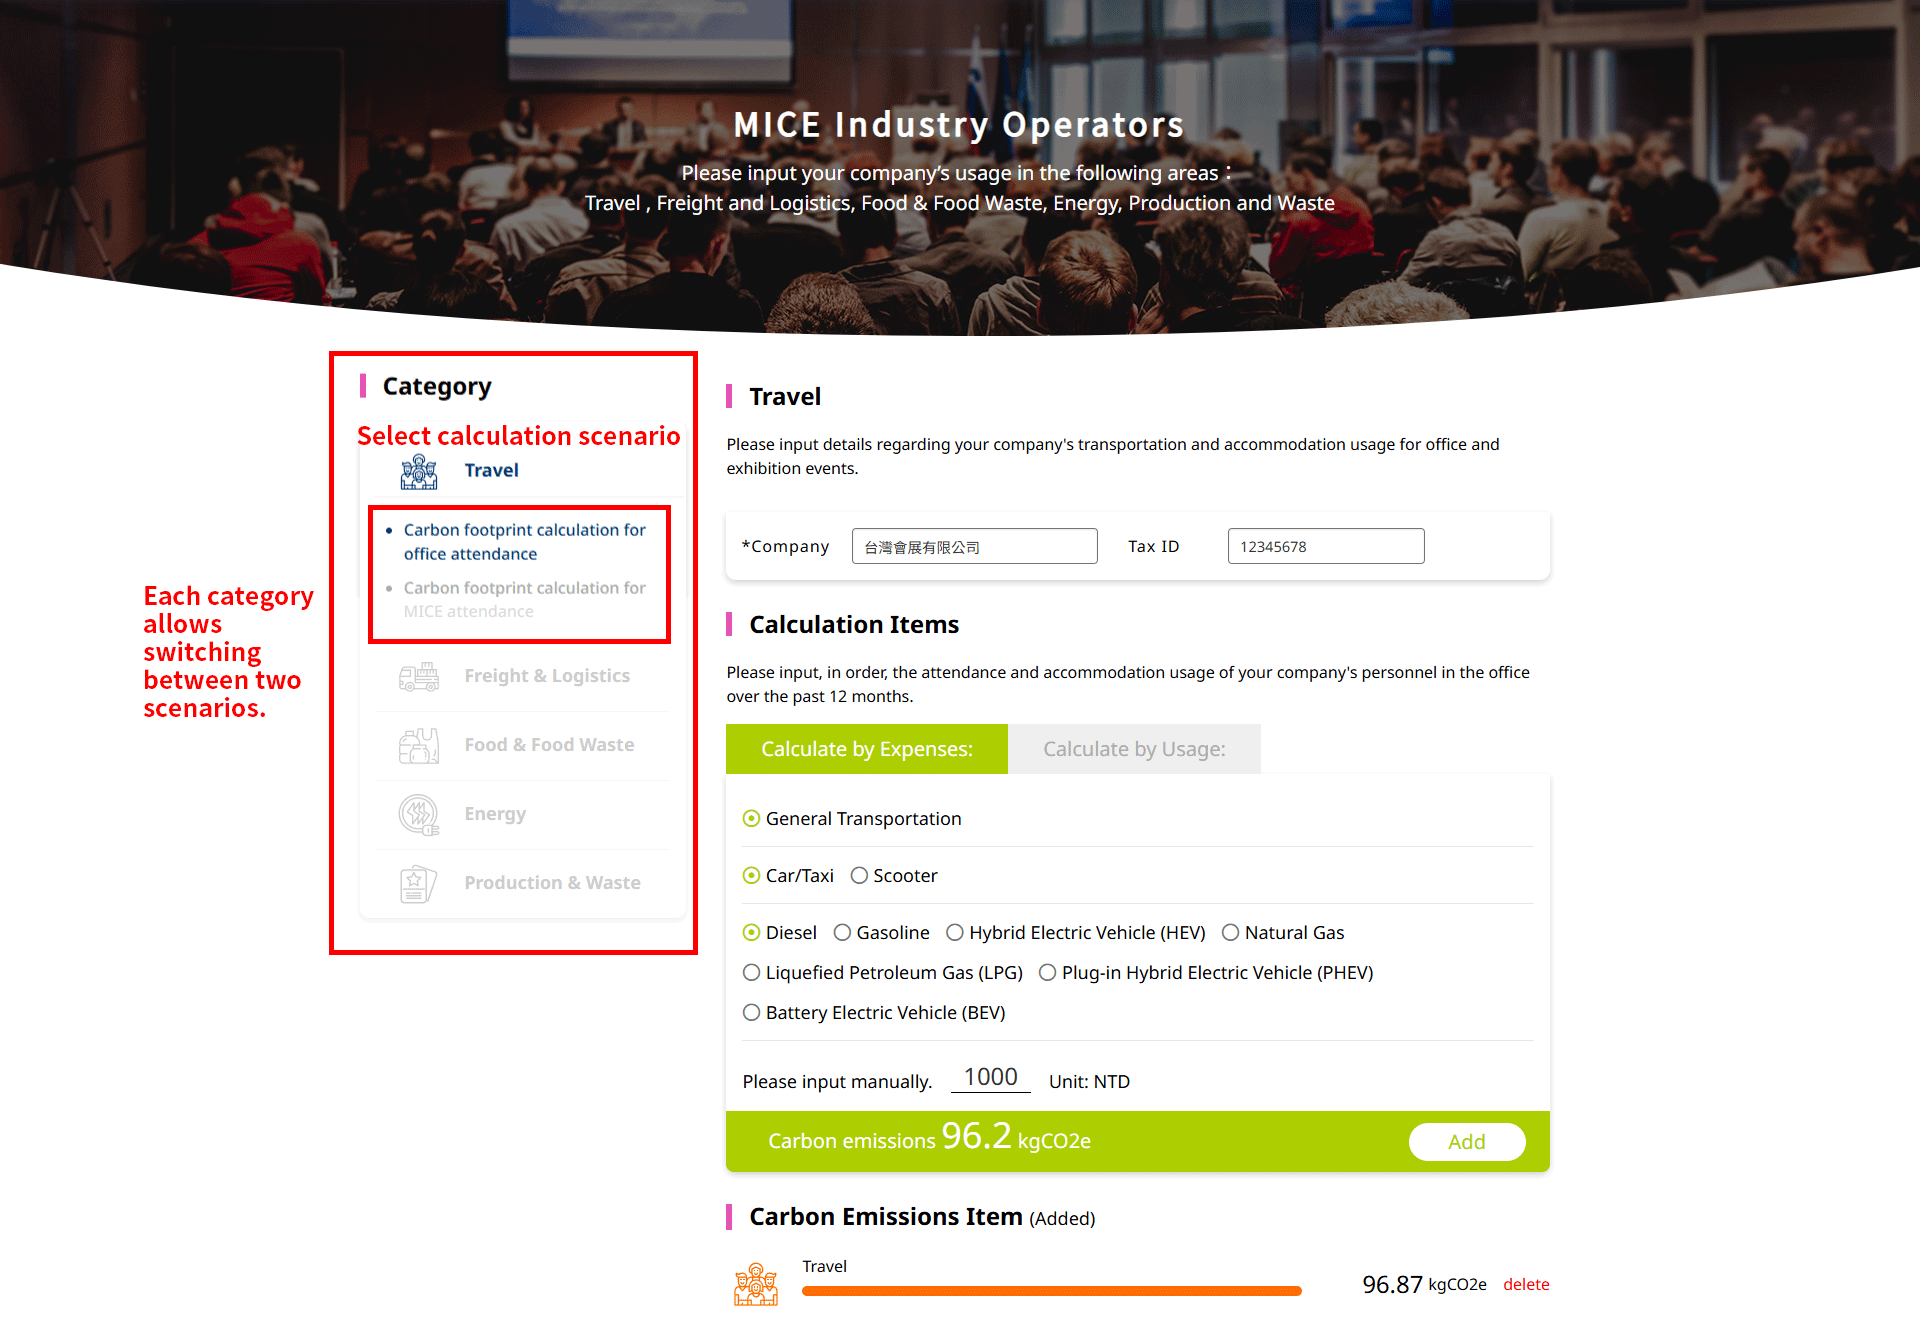
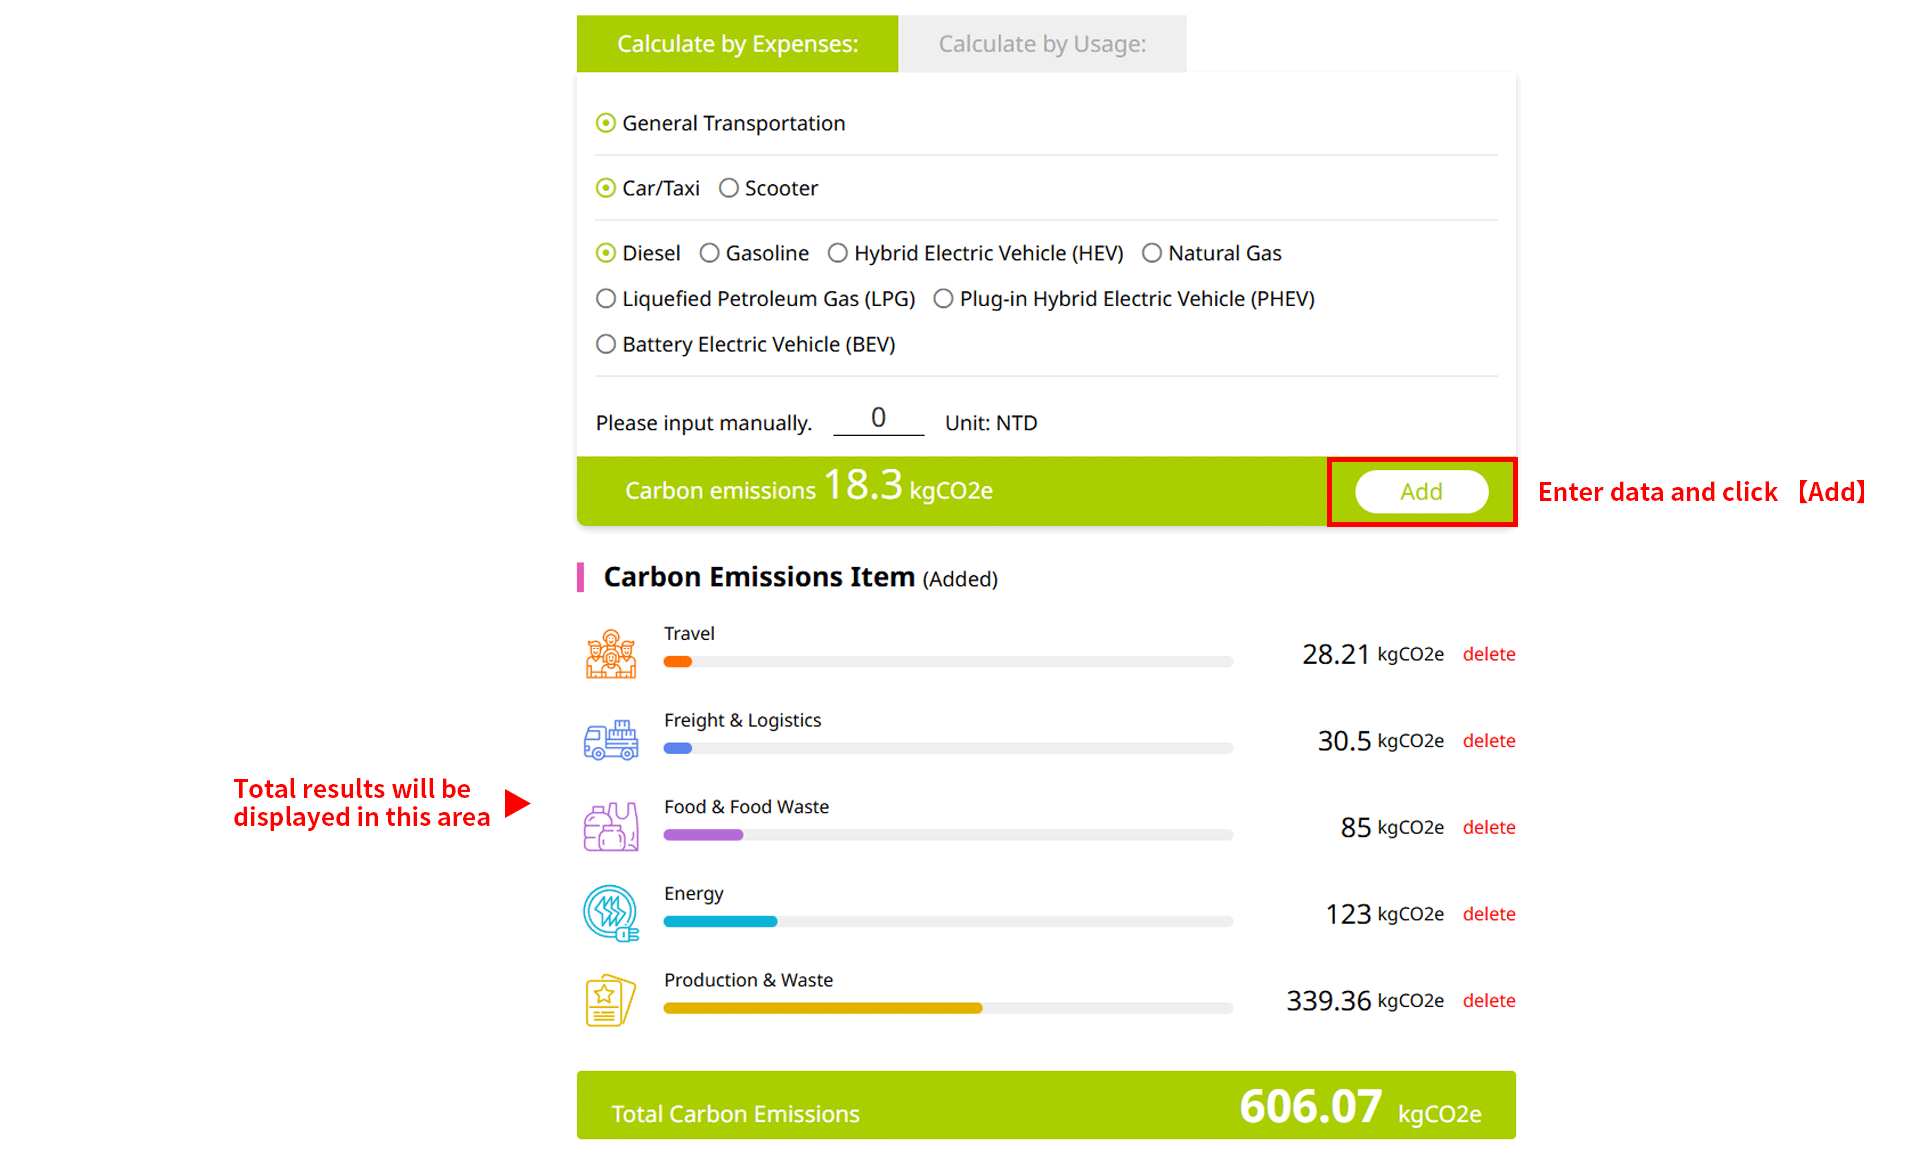
1.General Transportation: Energy consumption of cars/taxis, scooters, and other vehicles, including diesel, gasoline, hybrid electric vehicles (HEVs), natural gas, liquefied petroleum gas (LPG), plug-in hybrid electric vehicles (PHEVs), and battery electric vehicles (BEVs).

2.Public Transportation: Includes buses, MRT, Taiwan High Speed Rail (THSR), domestic flights, and other modes of transit.

3.Accommodations: Based on a “double occupancy” (two people per room) unit, with the actual number of nights stayed reported.

II. Freight & Logistics

Emissions from the transportation of goods for offices and exhibition activities. Currently focused on land transportation, including the energy usage (diesel, gasoline, natural gas, liquefied petroleum gas (LPG), and battery electric vehicles (BEVs)) of small and large trucks.

III. Food & Food Waste

Office pantry energy usage (e.g., natural gas and liquefied petroleum gas (LPG)), and emissions from catering services during exhibition activities, including light meals, beverages, lunch boxes, and refreshments.

IV. Venue Energy

Energy and resource usage for office and exhibition activities, including electricity, water, natural gas, gasoline, fuel oil, liquefied petroleum gas (LPG), diesel, and the total floor area.

V. Production & Waste

Waste disposal from offices, and the usage of decorations, production, and promotional items during exhibition activities.

1.Waste: Emissions estimated based on weight.

2.Production items: Common exhibition materials such as wooden boards, acrylic, Styrofoam, foam board, glass, carpet, PVC banners, paint, photocopy paper, plastic tarp/canvas, honeycomb board, sustainable pineapple leaf fiber (PALF), and steel/aluminum trusses.

User Guide for the Carbon Footprint Calculator

Step 0|Login and Identity Selection

0-1 Login
・Click 【Login / Register】 at the top right of the page.
・If you are not yet a member, please complete the registration process first.

0-2 Identity Selection
After logging in, please select your identity:

・MICE Operators: Includes Professional Conference Organizers, Professional Exhibition Planning Companies, MICE Design and Construction Providers, venue providers, logistics providers, and event hosts.
This carbon footprint calculator is primarily designed for estimating the overall carbon footprint of MICE events, and this guide focuses on this category.

・MICE Participants: Includes exhibiting companies, attendees, speakers and guests, staff, media, or supporting vendors.
This category currently covers carbon emission estimations exclusively for transportation activities.

Source: MICE Industry Energy Saving and Carbon Reduction Zone
Figure 1.  Login and Select Identity

Step 1 | Select Emission Categories (5 Key Emission Categories)

After logging in, the five key emission categories of this calculator will be displayed on the left side of the screen:

Travel

Freight & Logistics

Food & Food Waste

Energy

Production & Waste

Please select the emission category you wish to estimate based on your event and requirements (e.g., 【Travel】). Each category will open its corresponding data input fields.

Source: MICE Industry Energy Saving and Carbon Reduction Zone
Figure 2.  Select 5 Key Emission Categories

Step 2 | Select Calculation Scenario (Office / MICE Event)

Two scenarios below are available for each emission category: ・Carbon footprint calculation for office attendance: Suitable for daily operational carbon emissions of general offices. ・Carbon footprint calculation for MICE attendance: Suitable for one-time exhibitions, conferences, forums, and other events. Once you have selected the “Emission Category” and “Calculation Scenario” on the left, the corresponding input fields will appear on the right side of the screen.

Source: MICE Industry Energy Saving and Carbon Reduction Zone
Figure 3. Select Calculation Scenario (Office / MICE)

Step 3 | Select Calculation Method (By Expenses / By Usage)

After selecting the emission category and scenario, the system offers two calculation methods: ・By Expenses: Suitable when specific usage data is unavailable and only the expenses are known. Examples: $900 for gasoline, $1,200 for natural gas. ・By Usage: Suitable when precise usage data is available. Examples: 150 kWh of electricity, 3 nights of accommodation, 1 liter of gasoline for a small truck. Please select the calculation method that best matches your data source before entering the information.

Source: MICE Industry Energy Saving and Carbon Reduction Zone
Figure 4. Select Calculation Method (By Expenses / By Usage)

Step 4 | Enter Multiple Data and Add to List

After selecting the calculation method, please enter your data in the input fields on the right. After completing each entry, click 【Add】. The system will automatically: ・Convert the data into carbon emissions and display it in the list below. ・Update and accumulate the total carbon emissions for this category. ・Synchronize and update the overall total carbon footprint for the entire event. You can enter and click 【Add】 multiple times as needed. Data that has not been “Added” will not be included in the calculation or appear in the list below.

Source: MICE Industry Energy Saving and Carbon Reduction Zone
Figure 5. Total Carbon Emissions

Source: MICE Industry Energy Saving and Carbon Reduction Zone
Figure 6. Total Carbon Emissions

Step 5 | View Total Carbon Footprint and Generate Report

After completing all entries for all the categories, a summary of the event’s total carbon emissions will be displayed at the bottom of the page, including: ・Carbon emissions for the five key categories (kgCO₂e), with color bars representing the emission ratio and distribution of each category. ・The total emissions for the event (e.g., Figure 6: 1214.16 kgCO₂e). After confirming all information is correct, please click 【MICE CARBON EMISSION CALCULATOR REPORT OUTPUT】, and the system will automatically compile and generate a complete report.

Source: MICE Industry Energy Saving and Carbon Reduction Zone
Figure 7. Remove Category

Detailed Report of Carbon Emissions

After clicking 【MICE CARBON EMISSION CALCULATOR REPORT OUTPUT】, the system will automatically compile all entered data and generate a detailed carbon emission report. This report presents the event’s total carbon emissions (kgCO₂e) and the distribution profile of the five key emission categories within the total emissions.

Source: MICE Industry Energy Saving and Carbon Reduction Zone
Figure 8. Total Event Emissions and Category Overview

1. Carbon emissions by emission category (Travel / Freight & Logistics / Food & Food Waste / Energy / Production & Waste)

The report uses a pie chart to present the ratio of the 5 key categories in relation to total emissions, assisting you in quickly identifying major emission categories (carbon hotspots). On the right side of the pie chart, the actual carbon emissions for each category (kgCO₂e) are displayed with color bars and numerical data, providing a clear comparison of the emission differences across all categories at a glance.

Source: MICE Industry Energy Saving and Carbon Reduction Zone
Figure 9. Carbon Emission Breakdown by 5 Key Categories

2. Emission details by category

After clicking 【Detailed Report of Carbon Emissions】 at the bottom right, you can review all added data by the 5 key categories and check the converted emission values (kgCO₂e) for each item.

Source: MICE Industry Energy Saving and Carbon Reduction Zone
Figure 10. Detailed Overview of 5 Key Emission Categories

Source: MICE Industry Energy Saving and Carbon Reduction Zone
Figure 11. Detailed Data for a Single Emission Category

Recalculate, Print & Save

Recalculate

Click 【Recalculate Carbon Emissions】 at the bottom of the page to return to the 【Carbon Footprint Calculator】 login page. This allows you to create new entries and input new event data to start a new calculation.

Print

Click 【Detailed Report Output】 at the bottom of the page to print the report if needed. The system will immediately open the browser’s default print function, which supports both standard printing and PDF export.

Source: MICE Industry Energy Saving and Carbon Reduction Zone
Figure 12. Report Printing / Recalculation

Save Report

After clicking 【MICE CARBON EMISSION CALCULATOR REPORT OUTPUT】, the system automatically saves the report to the 【Member Centre】. To access your saved documents, log in and click the profile icon in the top-right corner. For future event estimations, the Member Center will retain your previous report; however, once a new report is generated, the system will automatically overwrite it with the latest version.

Source: MICE Industry Energy Saving and Carbon Reduction Zone
Figure 13. View Latest Carbon Emission Report

scrollTop